


Unusual in the predominance of multi-family housing complexes as opposed to single-family homes, Mountain View is a popular choice for newcomers and single professionals. Other distinguishing characteristics of community life include a robust local economy based on high technology firms–and an equally thriving and glittering nightlife.
Among the 200 manufacturing and high-tech firms that have settled into Mountain View are Silicon Graphics, Alza, Microsoft, and Netscape. At the NASA Ames Research Center, some of the nation’s most brilliant minds are researching computer systems for 21st century space exploration.
Most of the single-family dwellings are located west of El Camino Real, although handsome new homes and modern townhouses with innovative architecture are also springing up along the light-rail corridor near the Central Expressway.
Mirroring the upbeat real estate tempo set by many Silicon Valley communities, Mountain View has been able to enjoy rising home and property values. This widespread trend encourages remodeling and renovation, ensuring that even older neighborhoods will offer the visual appeal of neat homes and meticulous landscaping.
Amenities are excellent, from the revitalized downtown district to the new city hall and Performing Arts Center. Mature trees, brick sidewalks, and kiosks encourage residents to stroll casually down the streets in the evenings and on weekends, creating a warm and inviting atmosphere.
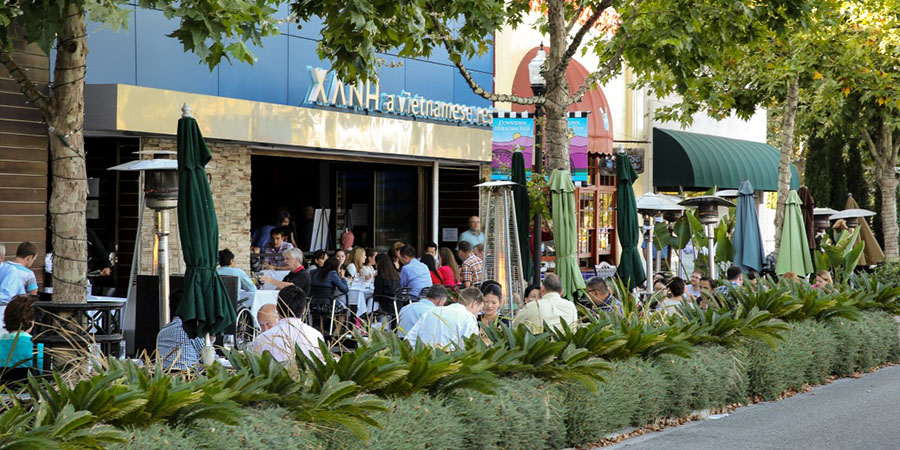
Wonderful cultural and recreational opportunities, shopping facilities, fine restaurants, and night clubs with live music and dancing add to the allure and vibrancy of Mountain View. For world-class cultural and educational attractions, Palo Alto and Stanford University are just around the corner.
Mountain View
Municipal Offices
650-903-6300
www.ci.mtnview.ca.us
Chamber of Commerce
650-968-8378
www.mountainviewchamber.org
Grant (30-day trend) Number of PropertiesAvg PriceAvg $/SQFTAvg DOM% of Avg Sold Price/Avg List PriceActive2 (Number of Properties)$3,562,256 (Avg Price)$1,390 (Avg $/SQFT)9 (Avg DOM)Sold4 (Number of Properties)$3,965,297 (Avg Price)$1,775 (Avg $/SQFT)32 (Avg DOM)118% (% of Avg Sold Price/Avg List Price)Downtown Mountain View (30-day trend) Number of PropertiesAvg PriceAvg $/SQFTAvg DOM% of Avg Sold Price/Avg List PriceActive3 (Number of Properties)$2,626,451 (Avg Price)$1,797 (Avg $/SQFT)32 (Avg DOM)Sold5 (Number of Properties)$2,088,684 (Avg Price)$1,417 (Avg $/SQFT)38 (Avg DOM)104% (% of Avg Sold Price/Avg List Price)Miramonte (30-day trend) Number of PropertiesAvg PriceAvg $/SQFTAvg DOM% of Avg Sold Price/Avg List PriceActive4 (Number of Properties)$3,790,124 (Avg Price)$1,489 (Avg $/SQFT)29 (Avg DOM)Sold5 (Number of Properties)$3,548,500 (Avg Price)$1,819 (Avg $/SQFT)21 (Avg DOM)111% (% of Avg Sold Price/Avg List Price)Rengstorff (30-day trend) Number of PropertiesAvg PriceAvg $/SQFTAvg DOM% of Avg Sold Price/Avg List PriceActive3 (Number of Properties)$1,647,206 (Avg Price)$1,212 (Avg $/SQFT)16 (Avg DOM)Sold3 (Number of Properties)$1,381,617 (Avg Price)$1,042 (Avg $/SQFT)40 (Avg DOM)104% (% of Avg Sold Price/Avg List Price)Sylvan Dale (30-day trend) Number of PropertiesAvg PriceAvg $/SQFTAvg DOM% of Avg Sold Price/Avg List PriceActive0 (Number of Properties)$2,498,000 (Avg Price)$1,196 (Avg $/SQFT)4 (Avg DOM)Sold1 (Number of Properties)$2,846,021 (Avg Price)$1,336 (Avg $/SQFT)26 (Avg DOM)126% (% of Avg Sold Price/Avg List Price)North Shoreline (30-day trend) Number of PropertiesAvg PriceAvg $/SQFTAvg DOM% of Avg Sold Price/Avg List PriceActive4 (Number of Properties)$1,100,777 (Avg Price)$984 (Avg $/SQFT)61 (Avg DOM)Sold7 (Number of Properties)$1,328,247 (Avg Price)$1,032 (Avg $/SQFT)44 (Avg DOM)104% (% of Avg Sold Price/Avg List Price)San Antonio (30-day trend) Number of PropertiesAvg PriceAvg $/SQFTAvg DOM% of Avg Sold Price/Avg List PriceActive5 (Number of Properties)$958,622 (Avg Price)$899 (Avg $/SQFT)63 (Avg DOM)Sold7 (Number of Properties)$1,275,302 (Avg Price)$946 (Avg $/SQFT)45 (Avg DOM)103% (% of Avg Sold Price/Avg List Price)Thompson (30-day trend) Number of PropertiesAvg PriceAvg $/SQFTAvg DOM% of Avg Sold Price/Avg List PriceActive1 (Number of Properties)$1,758,400 (Avg Price)$1,197 (Avg $/SQFT)94 (Avg DOM)Sold2 (Number of Properties)$1,971,311 (Avg Price)$1,483 (Avg $/SQFT)41 (Avg DOM)108% (% of Avg Sold Price/Avg List Price)Whisman (30-day trend) Number of PropertiesAvg PriceAvg $/SQFTAvg DOM% of Avg Sold Price/Avg List PriceActive5 (Number of Properties)$1,313,329 (Avg Price)$975 (Avg $/SQFT)75 (Avg DOM)Sold8 (Number of Properties)$1,841,203 (Avg Price)$1,123 (Avg $/SQFT)36 (Avg DOM)107% (% of Avg Sold Price/Avg List Price)
Property Info


